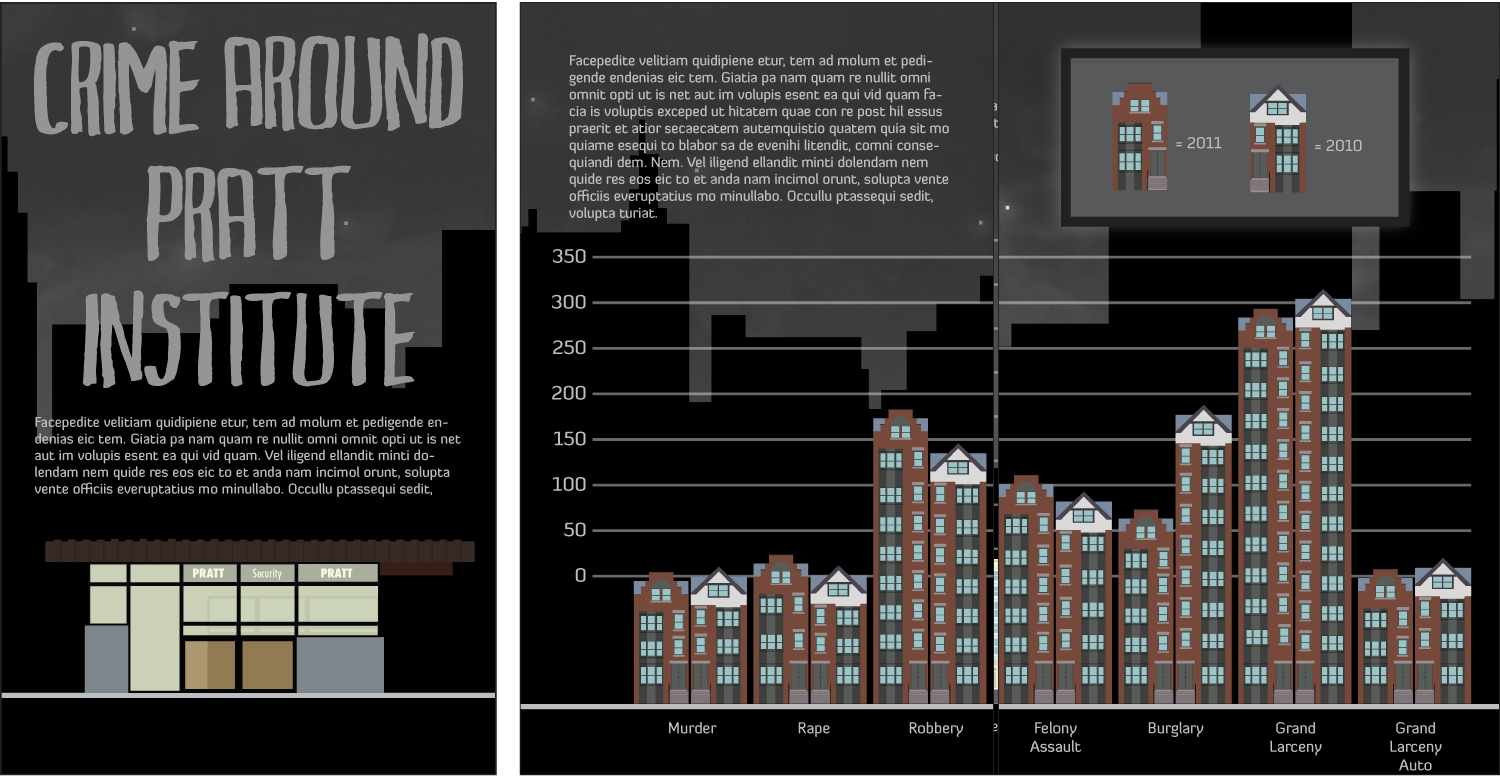
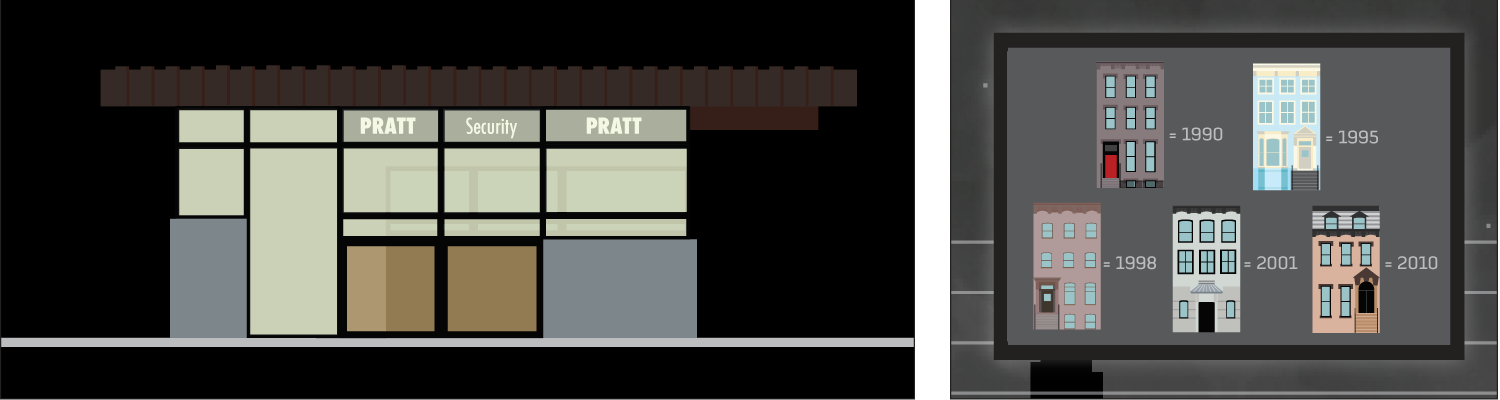
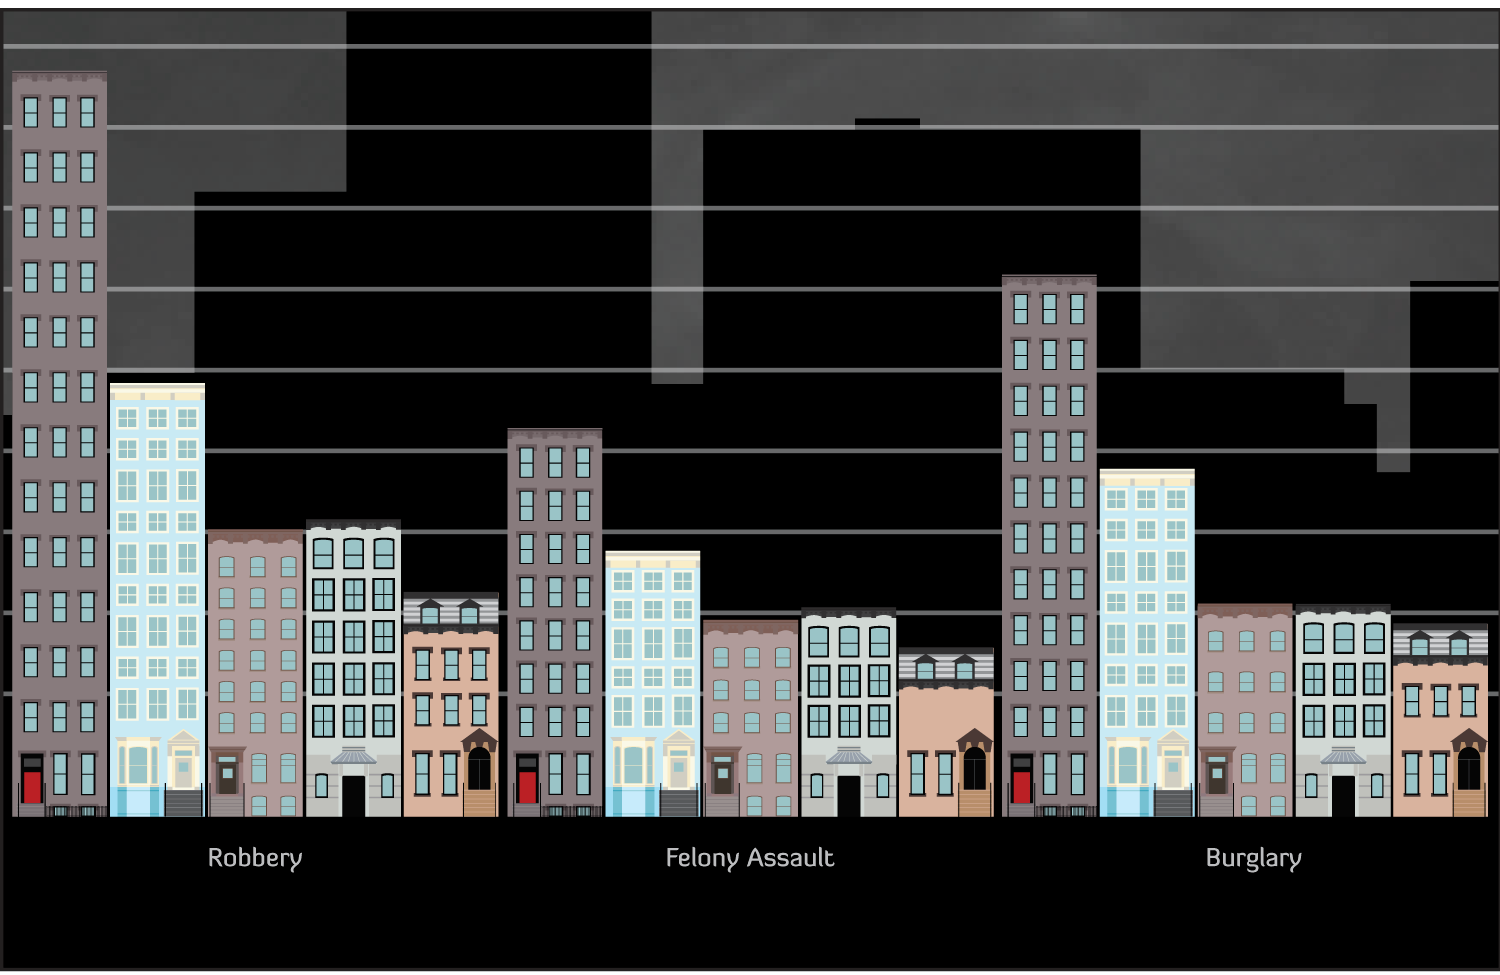
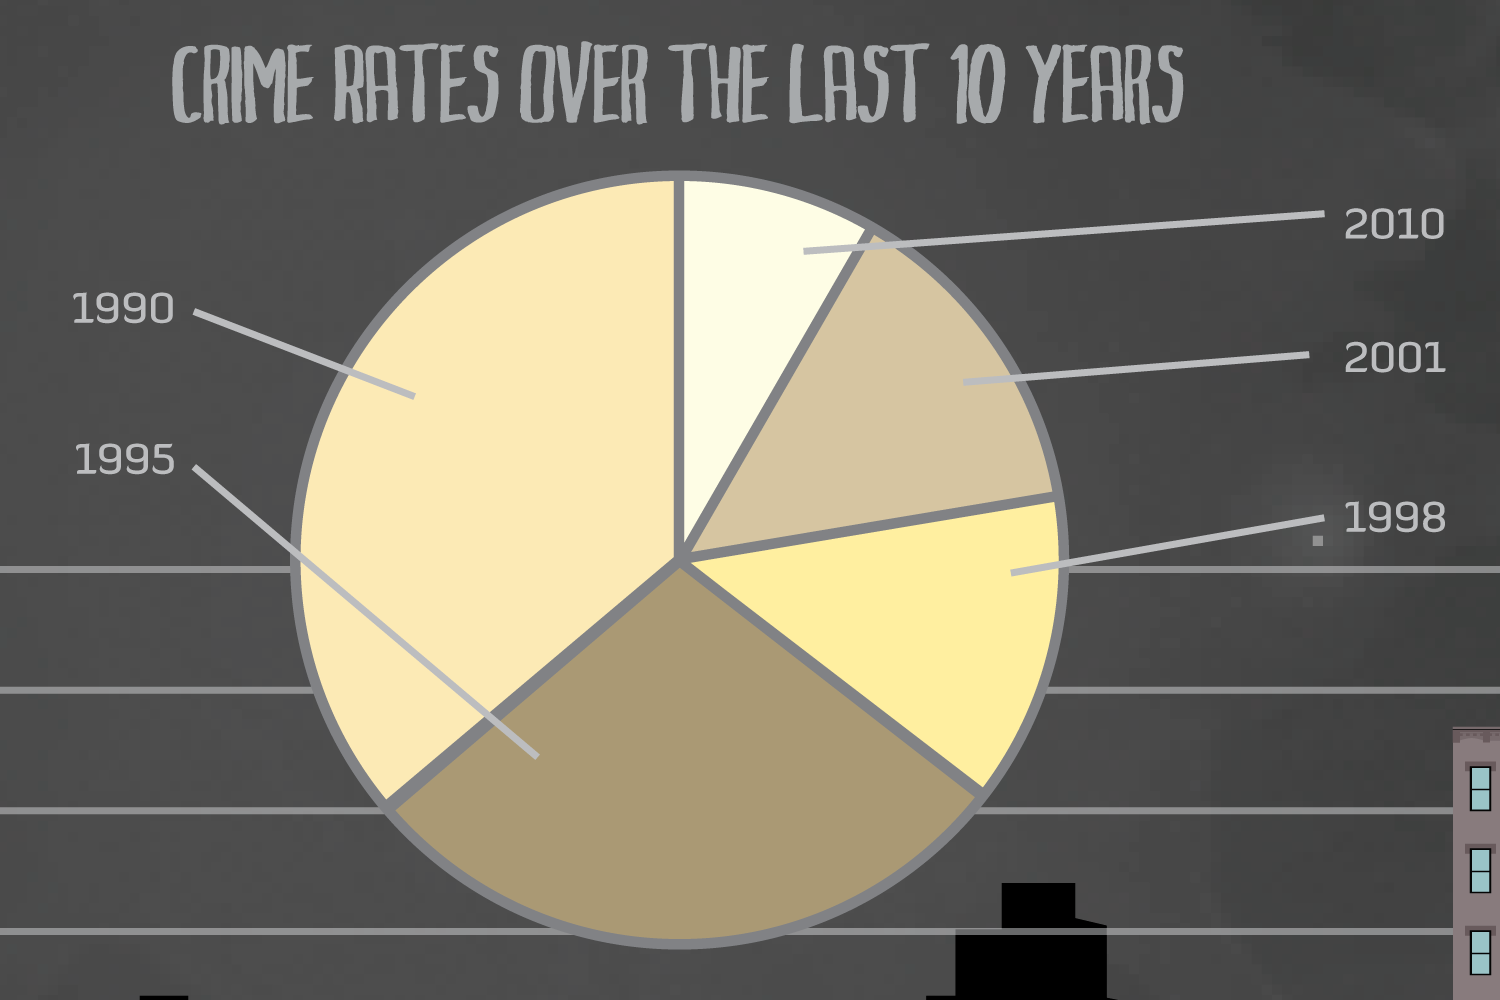
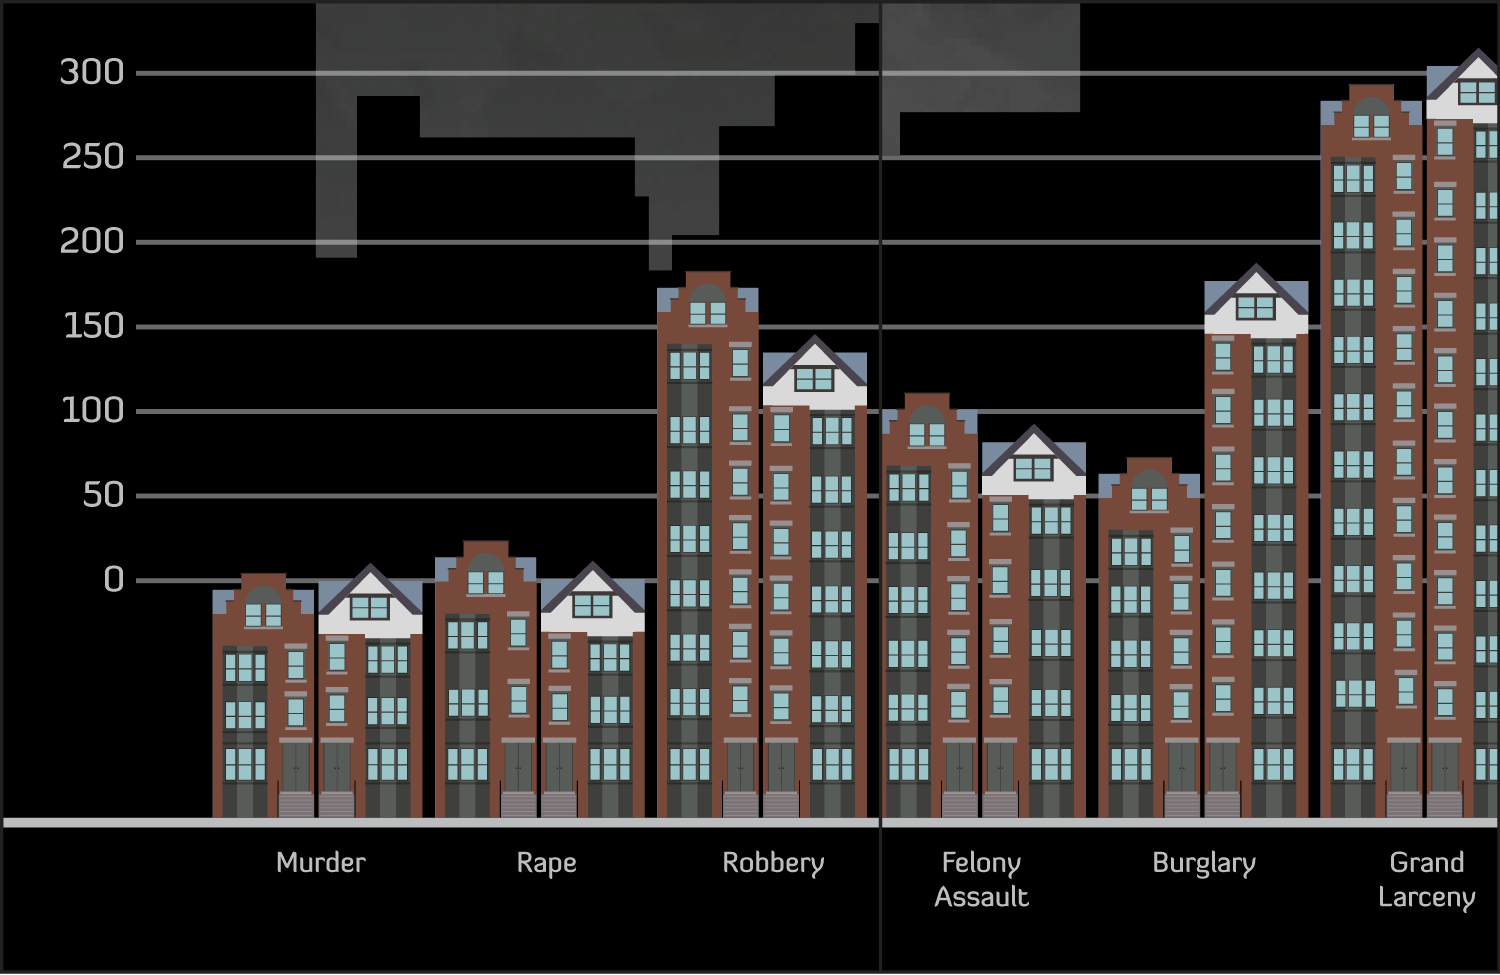
I used illustrations of real buildings in the area to show the crime rates in the neighborhoods surrounding my school in Brooklyn. These create bar graphs and convey a great deal of information in a way that is easy to understand.